
Humanity’s dependency on mobile devices has boosted the need for almost all organizations, private or public, from all sectors to have a presence on our phones and other mobile devices. Therefore, mobile device market penetration is the main factor for the growth of the mobile apps market.
This business model can be viewed from 2 different perspectives, or through a combination of both:
- As an extended source of an original business model such as media, e-commerce or SaaS
- As a stand-alone business activity, such as games and social networking.
This business model emerged from the expansion of the iPhone and Android smartphones’ ecosystems, which now support all sorts of other technologies including IoT and virtual reality. How big is this market now? Well, here are a few facts:
- The iOS App Store has more than 1.85 million applications and the Google Play Store has more than 2.56 million, and thousands of new applications go live every day (Statista).
- By 2021, there will be roughly 7 billion mobile users worldwide (Statista).
- According to Appanie’s “State of Mobile 2021” report, in 2020:
- An app was download 218 billion times.
- $143bn was spent on app stores.
- Daily time spent on a mobile per user reached 4.2h.
- 92% of time spent on a mobile is using apps, while social networking and communication apps account for 44% (Hootsuite).
- $240bn was spent on mobile app ads.
- VC investment in mobile tech reached $73bn in 2020 (Crunchbase).
Mobile apps business model cycle:
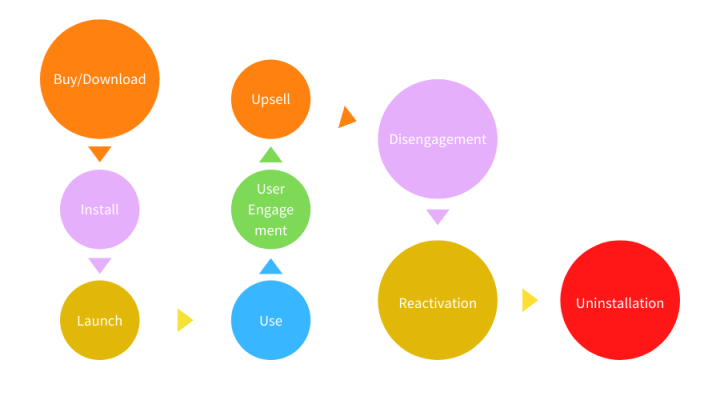
Mobile apps make money through:
- App purchase
- Downloadable content
- Customization
- Upsell
- Advantages (game apps)
- Elimination of countdown timers
- Cross-selling
- In-app ads
Applied Metrics in Mobile Apps
Downloads
- Hou many people have downloaded the application.
Customer acquisition cost (CAC)
- How much it costs to get a user and to get a paying customer.
Launch rate
- The percentage of people who download the app then actually launch it and create an account.
Percent of active users/players
- The percentage of users who have launched the application and use it on a daily and monthly basis: these are your daily active users (DAU) and monthly active users (MAU).
Percentage of users who pay
- How many of your users ever pay for something.
Time to first purchase
- How long it takes after activation for a user to make a purchase.
Monthly average revenue per user (ARPU)
- This is taken from both purchases and watched ads. Typically, this also includes application-specific information such as which screens or items encourage the most purchases. Also look at your ARPPU, which is the average revenue per paying user.
Ratings click-through
- The percentage of users who put a rating or a review in an app store.
Virality
- On average, how many new users a user invites.
Churn
- How many customers have uninstalled the application, or haven’t launched it within a certain time period.
Customer lifetime value
- How much a user is worth from cradle to grave. In the case of a mobile app, LTV is calculated using averages of the money spent by every player post-churn.
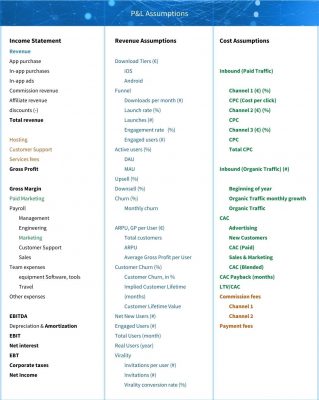
P&L Assumptions
This article was written by José Ramírez Terc, specialist in 21st century business models.


About ONEtoONE
ONEtoONE Corporate Finance specializes in international middle-market M&A advisory. We are continuously focusing on improving the techniques to achieve the best possible price for our clients. Moreover, we advise on acquisitions, strategic planning and valuation and are pleased to give our opinion about any other aspects of a possible corporate operation. If you need an advisor while buying or selling a company, contact us.