
In this article, we will talk about general metrics used in 21st century business models. We will first explain some general metrics applied to almost all of the models, and then we will dig deeper into some of the 21st century models in the 3rd part of this series. We will explain their general value propositions, highlight metrics to evaluate them and expand on other relevant information.
Referring to Metcalfe’s Law (which states that the value or utility of a network is proportional to the number of users of the web), the main goal of these companies is to grow at an exponential pace by attracting and engaging a network of users/customers.
We need to understand that these companies require the infrastructure to support the inflow of clients, so they spend at what appears to be an unsustainable rate. Hence, we need a new way of analysing 21st century companies.
There are increasing returns to scale in 21st century businesses, which differs from how returns accrue to old-world businesses. Because growth and maintaining the architecture that supports that growth is their primary mission, we need to look at how we assess these companies to understand why sometimes a lack of earnings and a correspondingly high multiple might not necessarily be a bad thing.
Even if a 21st century company is profitable, understanding which metrics directly affect these companies’ valuations will help understand their business models better to make a better assessment. In the following sections, we will review some of the 21st century models.
2 types of general metrics used in 21st Century Business Models
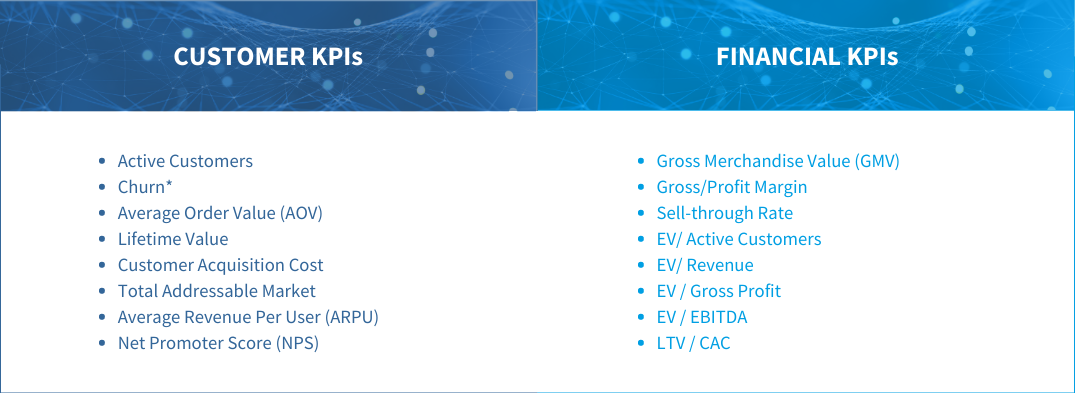
When assessing a 21st century business plan and financial model, there are two types of general KPIs, customer and financial. We can say that these available metrics are the root for all the other metrics to be explained in this series and they are employed differently in different business models.
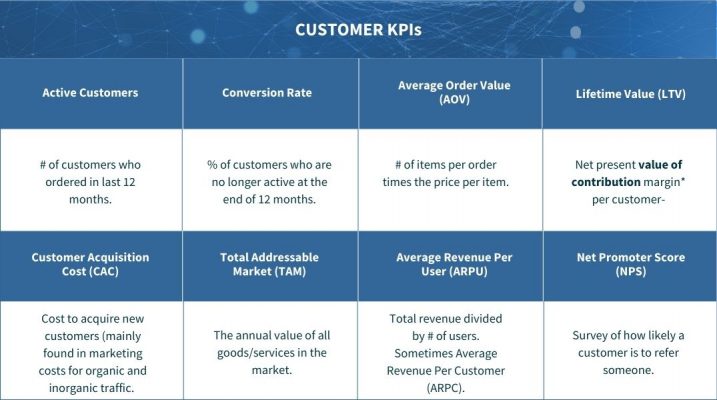
Customer KPIs directly affect the uppermost items in a P&L. They are more related to customer acquisitions, which turns into revenues. They explain in a broad sense how the network effects are materialising in a business. If there is any recurrence from customers, these metrics can explain how these customers convert into future cash flows. All in all, these are the revenue drivers.
Financial KPIs are used to explain the value of these customers/users in a comprehensive valuation. They also explain how direct costs affect that value. We are more used to financial KPIs than customer KPIs. From here on, each 21st century business models is reflected in branches of both these general KPIs.
Contribution Margin = Net Sales Revenue – Variable Costs Contribution Margin Ratio = (Net Sales Revenue -Variable Costs ) / (Sales Revenue)
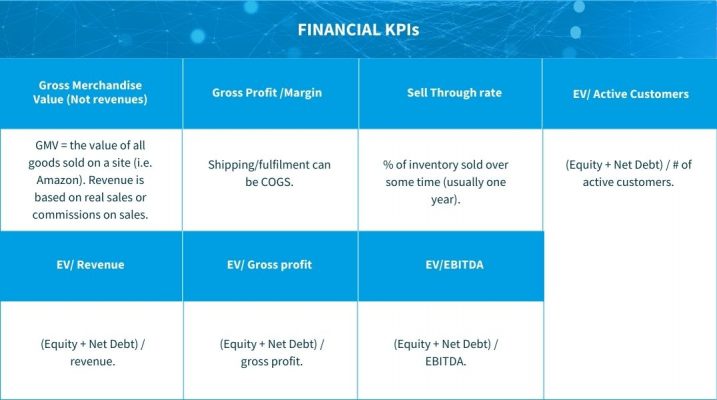
1. In a marketplace model, GMV is probably extremely high compared to actual revenues as it takes all sales made through the platform instead of the income received. 2. For companies with no net profits or positive EBITDA but with a strong user/customer base and high growth, it is best to use EV/active users or EV Revenue (Sometimes Annual Recurring Revenues (ARR)) for valuation purposes.
Explaining Churn
Customer Churn:
- Measures how much business you’ve lost within a specific period. It is one of the most critical metrics in tracking the day-to-day vitality of your business.
- As most digital businesses operate under some recurring revenue model, keeping customers is as important as acquiring new ones.
- To calculate customer churn take all your monthly recurring revenue (MRR) at the beginning of the month and divide it by the regular monthly payment you lost that month minus any upgrades or additional revenue from existing customers.
- Customer churn rate = (Customers beginning of the month – customers end of the month)/customers beginning of the month.
- Do not include new sales in the month, as you are looking for how much total revenue you lost.
Revenue Churn:
- It’s essential to measure revenue churn alongside customer churn to evaluate the outside impact some customers might have over others. Tracking and understanding revenue churn is necessary for measuring a company’s financial performance and outlook.
- To calculate revenue churn, take the monthly recurring revenue (MRR) you lost that month — minus any upgrades or additional revenue from existing customers, and divide it by your total MRR at the beginning of the month.
Explaining Lifetime Value / Customer Acquisition Cost (LTV/CAC):
Customer Acquisition Cost (CAC)
- It shows precisely how much it costs to acquire new customers and how much value they bring to your business.
- When combined with LTV, this metric helps companies guarantee that their business model is viable.
- To calculate CAC, divide your total sales and marketing spend (including personnel) by the total number of new customers you add during a given time. For example, if you spend $100,000 over a month and added 100 new customers, your CAC would be $1,000.
CAC Payback Period:
- It helps determine how long after you’ve closed a customer you recoup the total CAC. In other words, CAC Payback Period gives you an idea of how quickly a customer starts to generate ROI for your business.
- CAC Payback Period is calculated by taking your Customer Acquisition Cost (CAC) divided by your Average Revenue per Customer (ARPU). CAC Payback Period = CAC / ARPU
- The general benchmark for startups to recover CAC is 12 months or less. High performing SaaS companies have an average CAC payback period of 5-7 months.
Lifetime Value (LTV):
- The average amount of money that your customers pay during their engagement with your company. The metric provides businesses with an accurate portrayal of their growth and can be explained in three steps:
- Divide the number 1 by your customer churn rate. For example, if your monthly churn rate is 1%, your customer lifetime rate would be 100 (1/0.01 = 100).
- Find your average revenue per account (ARPA) by dividing total revenue by the total number of customers. If your revenue was $100,000, divide it by 100 customers and your ARPA would be $1,000 ($100,000/100 = $1,000).
- Finally, find your LTV by multiplying customer lifetime by ARPA. In this example, your LTV would be $100,000 ($1,000 x 100 = $100,000).
- LTV shows what your average customer is worth. And for those still in the startup mode, it can display your company’s value to investors.
LTV / CAC:
- Shows the lifetime value of your customers and the total amount you spend to acquire them — in a single metric.
- Healthy between 3-5X. Anything lower than 3 means either you are spending too much or making lousy marketing investments. Anything higher than 5 could mean that you are not investing enough in your marketing, hence missing out on good potential business.
About ONEtoONE
Our company, ONEtoONE Corporate Finance, is specialized in international middle-market M&A advisory. We are continuously focusing on improving the techniques to achieve the best possible price for our clients, and we also advise on acquisitions, strategic planning and valuation. We are pleased to give our opinion about company valuation or other aspects of a possible corporate operation. If you need an advisor while buying or selling a company, contact us.